Introducing Observable Load Testing = Locust and OpenTelemetry!
At Locust, we love open source and OpenTelemetry. Integrating OpenTelemetry with Locust makes your load tests fully Observable.
The Challenge: Traditional load testing involves extensive, manual backend correlation and often hits dead ends due to blind spots within the application code and distributed systems. Built-in vendor monitoring options offer clues, but the full end-to-end performance story is often missing.
The Solution: By auto-instrumenting Locust scripts with OpenTelemetry, load tests will now emit OpenTelemetry signals. This load-test telemetry streams into your OTel-driven Observability platform in real time, enabling you to visualize every load-test request and follow its full transaction. Now, you have complete end-to-end visibility — your load requests correlated to your OTel instrumented application.
Locust Cloud is leading the way for native OpenTelemetry-driven Observable load tests! 🎉
This observability-driven approach transforms performance testing by empowering engineers to precisely correlate simulated workloads to limiting behaviors of applications. Now, you can pinpoint bottlenecks faster and collaborate on fixes across the entire DevOps team.
And what about those perplexing situations when your business transactions show a total response time that doesn’t match the full distributed trace? 🤔
Is the user experience being affected by an unmeasured or hidden latency? ➡️ Yes. Let’s show you exactly where to look.
Locust — It’s Just Python
Open-source Locust is already a favorite load-testing tool for performance engineers — it is built on easy-to-use Python, has flexibility to emulate realistic user behavior, and simulates realistic workloads. Locust has the added advantage of being written in Python, a language already supported by OpenTelemetry. 🎉
By instrumenting open-source Locust scripts with OpenTelemetry, engineers can now achieve complete end-to-end load test Observability.
Locust makes it easy to add OpenTelemetry to your load scripts!
Introducing the fantastic --otel flag
The Locust engineering team has implemented an innovative feature that automatically instruments load scripts to emit standardized telemetry — with the Flip of a Flag.
OTel is an optional dependency of Locust, available from version 2.42.4. Install it like this, or read the full documentation here.
pip install -U locust[otel]How it All Works…
As with any application using OTel, you will need to export the relevant environment variables. Each Observability platform is unique; please refer to the vendor instructions.
export OTEL_TRACES_EXPORTER=otlp
export OTEL_EXPORTER_OTLP_ENDPOINT=https://...
export OTEL_EXPORTER_OTLP_PROTOCOL=http/protobuf
Next, use the new --otel flag and let Locust automatically instrument. Every HTTP/S (HttpUser) request emits OpenTelemetry signals, specifically dimensional metrics and traces with context.
Below is a regular Locust load test. Easy to create, easy to maintain, easy to customize.
class MockTarget(HttpUser):
    @task
    def t(self):
        self.client.post("/authenticate", json={"user": "foo", "password": "bar"})

        for product_id in [1, 2, 42, 4711]:
            self.client.get(f"/product/{product_id}", name="/product/{product_id}")
            self.client.post("/cart/add", json={"productId": product_id})

        self.client.post("/checkout/confirm")
This specific script executes the following steps: logs in to a web application, browses four different products, adds them to a cart, and checks out.
The default destination for OpenTelemetry signals is typically a local Collector. In this case, for the first Locust OTel release, the script initializes the metric and trace exporters, relies on the OTel native RequestsInstrumentor for auto-instrumentation, and sends telemetry data to the Observability platform — directly from the load generators.
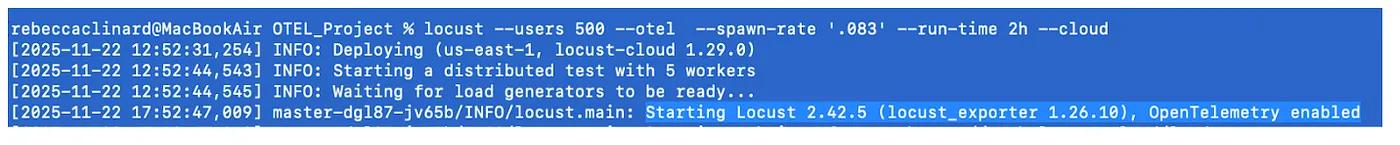
Auto-instrumentation is triggered at load-test startup, shown in the command line below.
locust -f ecommerce_shopper.py --otel --users 500 --spawn-rate .5
--run-time 1h --cloud
This command launches a load test using the script ecommerce_shopper.py. The --otel flag triggers the auto-otel-instrumentation. The peak load is 500 concurrent users, with a spawn rate of 1 user every 2 seconds, and the execution duration is 1 hour.
The--cloudflag uses Locust Cloud’s hosted test runners and requires an account, but OTel works for local runs as well!
Please note: Locust is ready for OpenTelemetry-instrumented load tests that use the HttpUser , but soon FastHttpUser will also be supported!
You can refer to our documentation for more advanced load scenarios, such as including running multiple scripts and custom load shapes.
When OTel is enabled, Locust will show it in the output as well:
Once the load test is initialized and load generators are ready, press ENTER to open a browser to launch and follow your test results in real time. Or you can use --headless, to start the test right away, which is also useful for automated CI/CD pipelines.
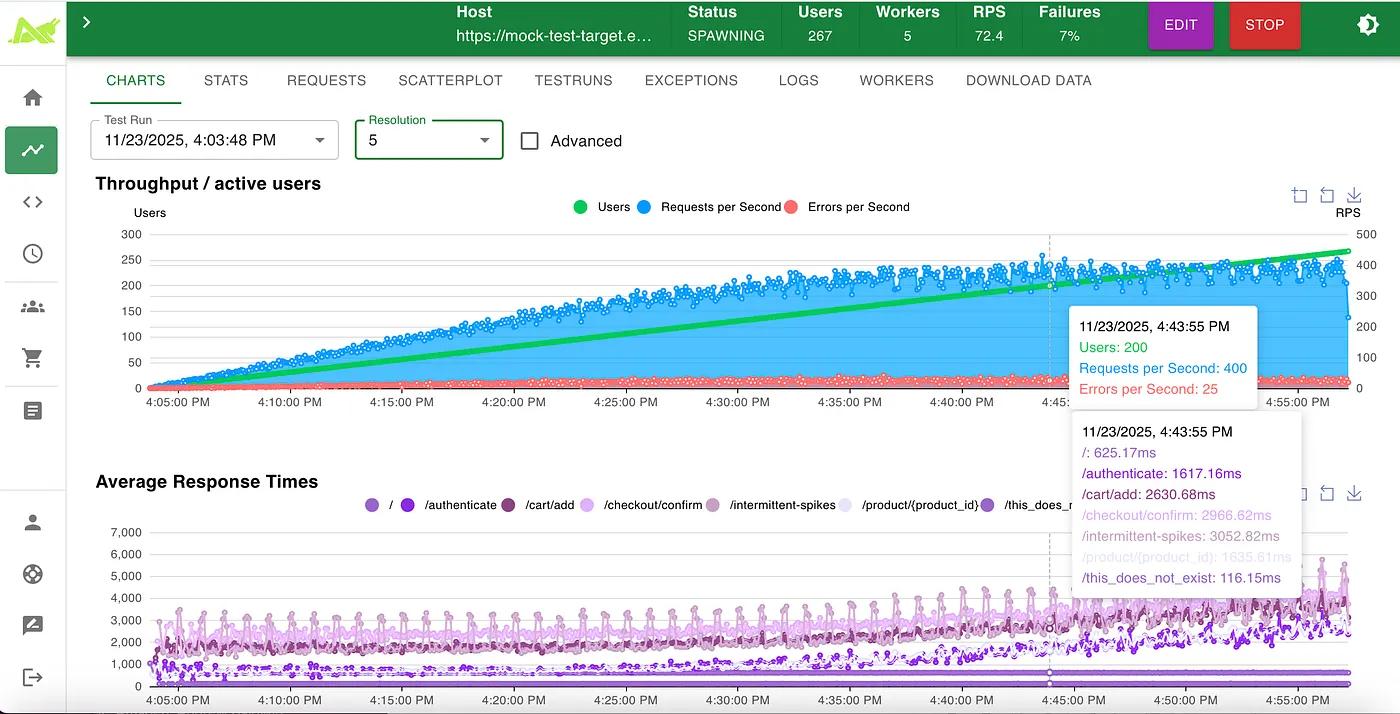
Locust Detailed Load Test Report with Real Time Resolution and needle-point correlation.
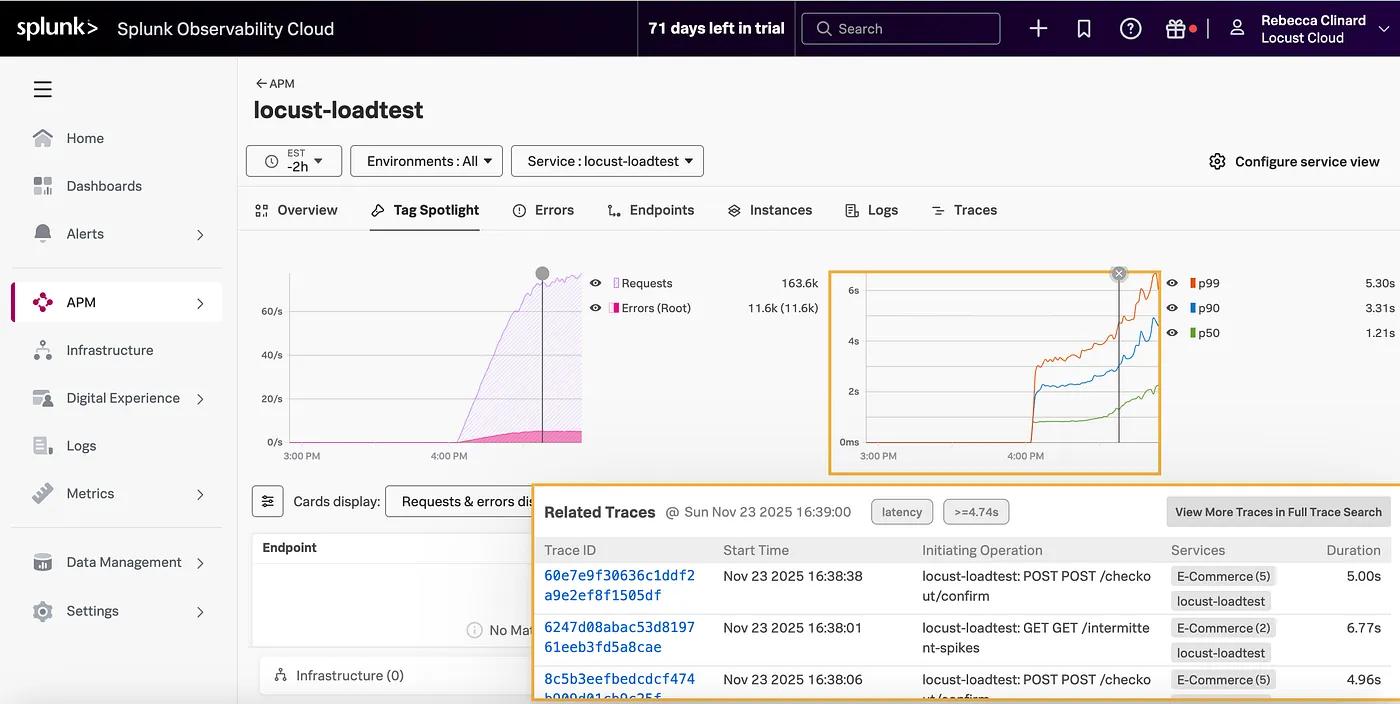
Observable Load Test (dimensional metrics) in the Splunk Observability Platform.

Observable Load Test showing Related Load Request Traces Accessed From Metrics.
For a Deeper Dive for our die-hard engineers (but you don’t need to know this to use it :)
Explanation of how OTel Context Propagation and Span Linking Work:
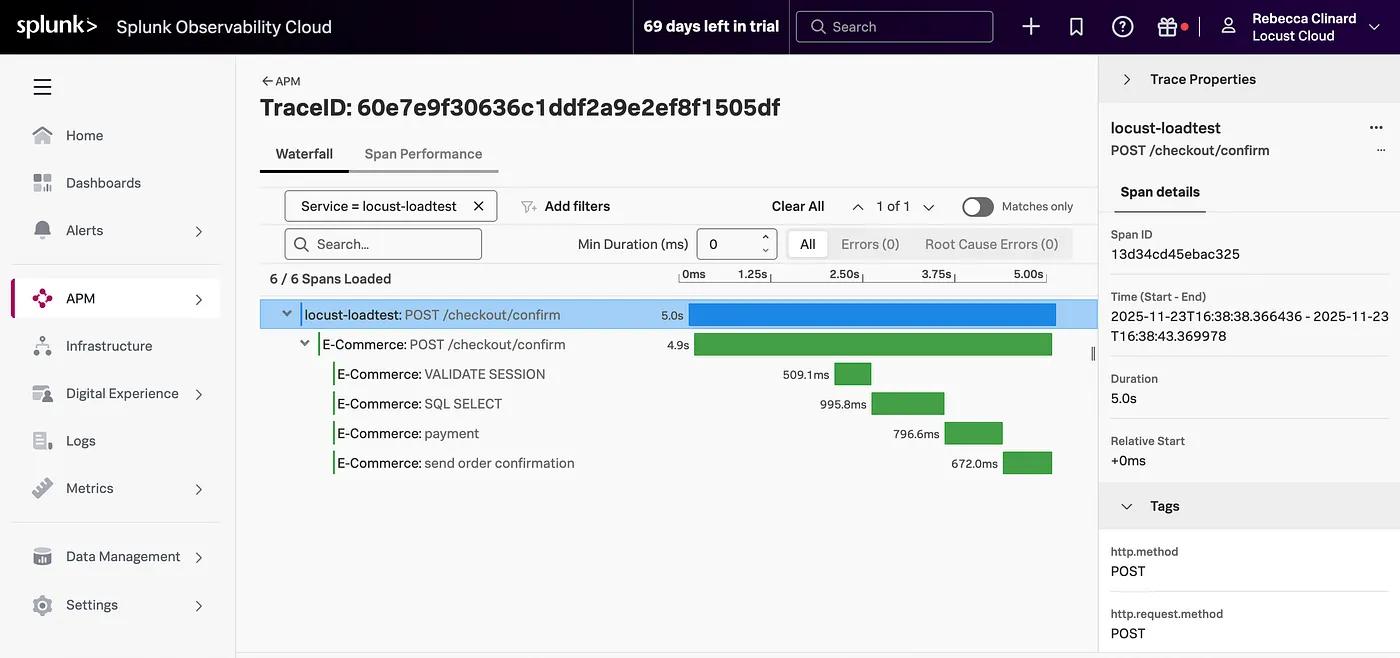
A single end-to-end trace from: Locust HttpUser → Microservice → Database → Downstream services
When you run a Locust load test with OpenTelemetry enabled, each HttpUser request creates an outbound client span — the root span. OpenTelemetry automatically adds W3C trace headers (like traceparent) to every request. When your target application is also instrumented with OpenTelemetry — or any APM that supports W3C Trace Context — it reads those headers, continues the same Trace ID, and creates a server span as a child of Locust’s span. This seamlessly links your load test traffic to your application traces, giving you full end-to-end visibility without any manual work.
The result is full end-to-end transaction visibility in your favorite OTel-driven Observability platform!
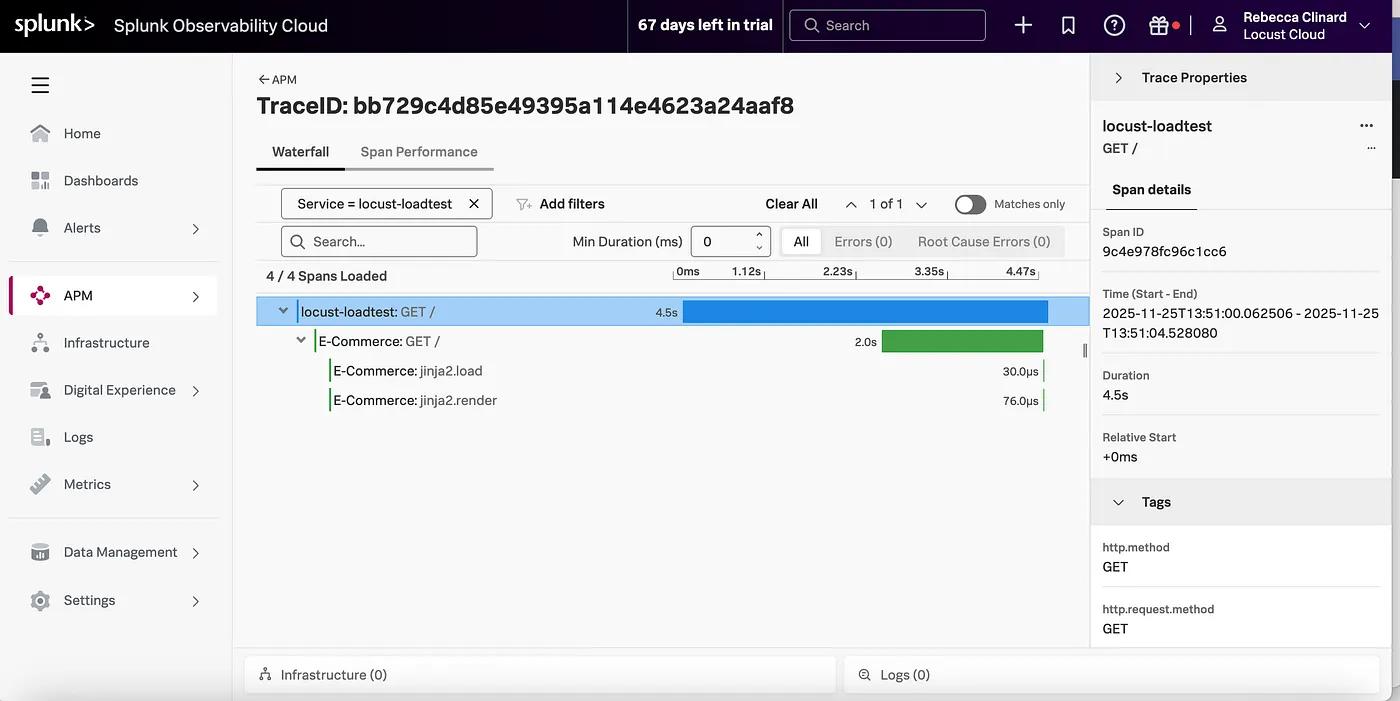
A full Trace that starts with a Locust Span: Note that the span name is the full URL of the HTTP request, which could be a web page or an API service call.
Now, your load tests aren’t just numbers in a report — they’re performance stories told in traces.
🔥 Performance engineering just got a Whole. Lot. Easier. Hooray!
👉 Run your next test in Locust Cloud — Are you ready for Enterprise reporting and on-demand cloud-hosted load generators? Sign up for a Free account to Get Started.
The Missing Piece: That First Span!
One of the coolest insights you’ll discover is the very first span in your trace — which includes the connection time from the Locust load generator (worker) to your target application.
Seeing this connection time is crucial because real users — like your load tests — connect to your web applications over the extranet. Connection delays can stem from packet loss, retransmissions, TIME_WAIT buildup, high server load, queuing, or resource saturation. Connection latency directly affects the total transaction time — and the customer’s digital experience. Quantifying this connection latency is key to methodical performance engineering.
This first (1st) Locust span is an essential differentiator because, in traditional load tests, connection times are hidden within the overall load results, specifically the response time metrics. With Observable load tests, the very next span (2nd) in a full trace shows the application’s Real response time. Between the two spans, it’s easy to visualize the overhead of the connection latency.
With connection spans visible, you can finally explain those missing time gaps — and once you can measure them, you can optimize them.
Full Trace with root span revealing a connection latency of over 2 seconds.
👉 Run your next test in Locust Cloud. Locust Cloud Load generators have the OpenTelemetry packages pre-installed. Ready When You Are!
Noise-Free Load Test Analysis within Shared Environments!
I’m sure we would all love to run load tests in quiet, production-like environments — but that’s rarely the case. If only, right?
Most lower-level and production environments are very noisy due to background traffic. In environments such as CI/CD pipelines, QA, or Staging, and of course, Production, there are often other simultaneous activities, causing noise. This common scenario makes it hard to tell which transactions originated from your load test’s virtual users, or even when your test began or ended.
Frustrating, right? 🫤
With Locust’s new OpenTelemetry feature, all load tests will automatically be isolated by Service Name. Making it easy to see precisely when your test started, when it ended, view metrics and trends clearly, and analyze only the relevant transactions.
Isolated load test analysis just got dramatically simpler. Hooray!
By default, the service name is locust, but you can change the service name by exporting this environment variable below.
OTEL_SERVICE_NAME=locust-loadtest
Note the isolated Load testing service in the Splunk observability platform.
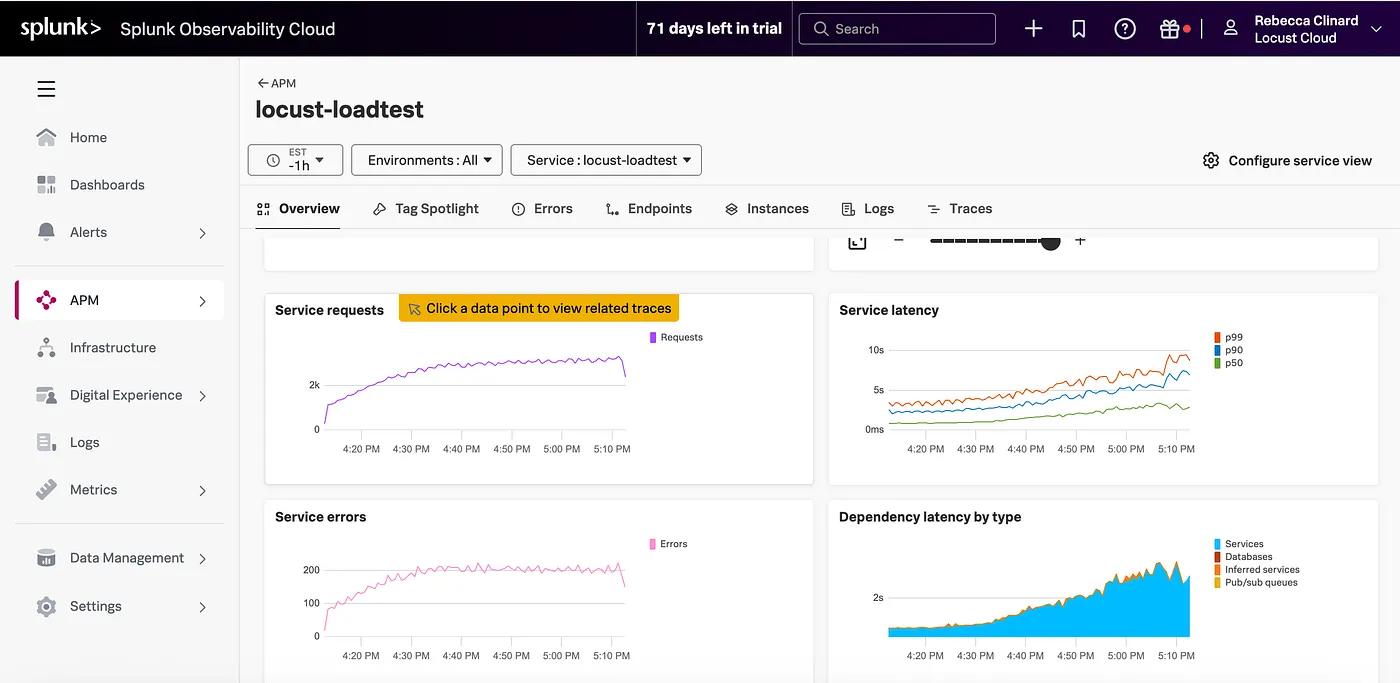
You can see clearly now, the clouds are gone! ☁️🎵
Here are some more complete examples of required Splunk OTEL environment variables:
OTEL_EXPORTER_OTLP_HEADERS=X-SF-TOKEN="..."
OTEL_EXPORTER_OTLP_TRACES_ENDPOINT="https://ingest.us1.signalfx.com/v2/trace/otlp"
OTEL_EXPORTER_OTLP_METRICS_ENDPOINT="https://ingest.us1.signalfx.com/v2/datapoint/otlp"
OTEL_EXPORTER_OTLP_METRICS_PROTOCOL=http
Please be aware: Sending OTel Load test telemetry to your Observability will increase your ingest, and vendor fees may apply. Also, check your favorite observability platform’s time-to-glass to display ingested metrics and trace — real-time experiences may vary per platform.
With OpenTelemetry + Locust, you have these added advantages:
✅ Isolation from background noise — load tests workloads are isolated from background noise.
⏱️ Start-to-finish clarity — know precisely when your load test began, ramped, and finished across your distributed services.
🌈 Full trace visibility — from the load generator through every backend hop — yes, even that elusive connection time you didn’t know you were missing.
🔬 True end-to-end insight — connect response times to underlying infrastructure metrics like K8s health, CPU, memory, and cloud resources in one view.
These fused Load testing + OpenTelemetry use cases are rapidly evolving. At Locust, we aim to help engineers create and execute methodical load testing — and simplify analysis!
Observability Advantages: AI-driven analysis
Riddle: When load test telemetry flows into modern observability platforms, what suddenly becomes smarter than your average dashboard?
Hint: It automatically correlates all OTel signals, analyzes spans that include the underlying hosted infrastructure, and spots bottlenecks before humans blink.
Answer: AI-powered insights, of course!
These Observability platforms have evolved so rapidly. Most are now capable of telling you Why performance degraded or at least give possible root causes — even without your manual investigation. Yes, you still need performance engineering skills 🔥; however, AI features can significantly reduce your analysis time. So why not take advantage?
✨Final Thought
Open-source Locust and OpenTelemetry turn load testing into a data-driven observability journey, where metrics tell us when performance begins to degrade, traces show both where and why the slowdown is happening (code or infrastructure), and logs provide even more detailed verbosity.
Locust Cloud is leading the way for native OpenTelemetry-driven load tests.
Why use the --cloud flag?
Locust Cloud provides on-demand, hosted load generators and Enterprise reporting (with a 180-day retention period). Our goal is simple — enable everyone to run load tests. We save you the hassle of manually setting up and maintaining your distributed Locust workers. We provide detailed enterprise reporting for all of your load tests — 180-day retention for historical analysis. Plus, you can utilize our Locust Kubernetes operator for on-premise load testing using your own Kubernetes clusters. Soon, with the same powerful reporting as the cloud version.
For reference, you can refer to the OpenTelemetry Locust documentation:
These OTel Observable load test use cases are evolving rapidly! We will continue to update you.
To learn more about what you’re missing when you performance test without observability, Please read our “Load Testing Gives You Yes/No Answers — Observability Tells You Why”!
Lars Holmberg & Rebecca Clinard • 2025-12-01
Back to all posts